Unknome Graphical Overview
These images are generated from the Unknome database updated on 18 Mar 2026.
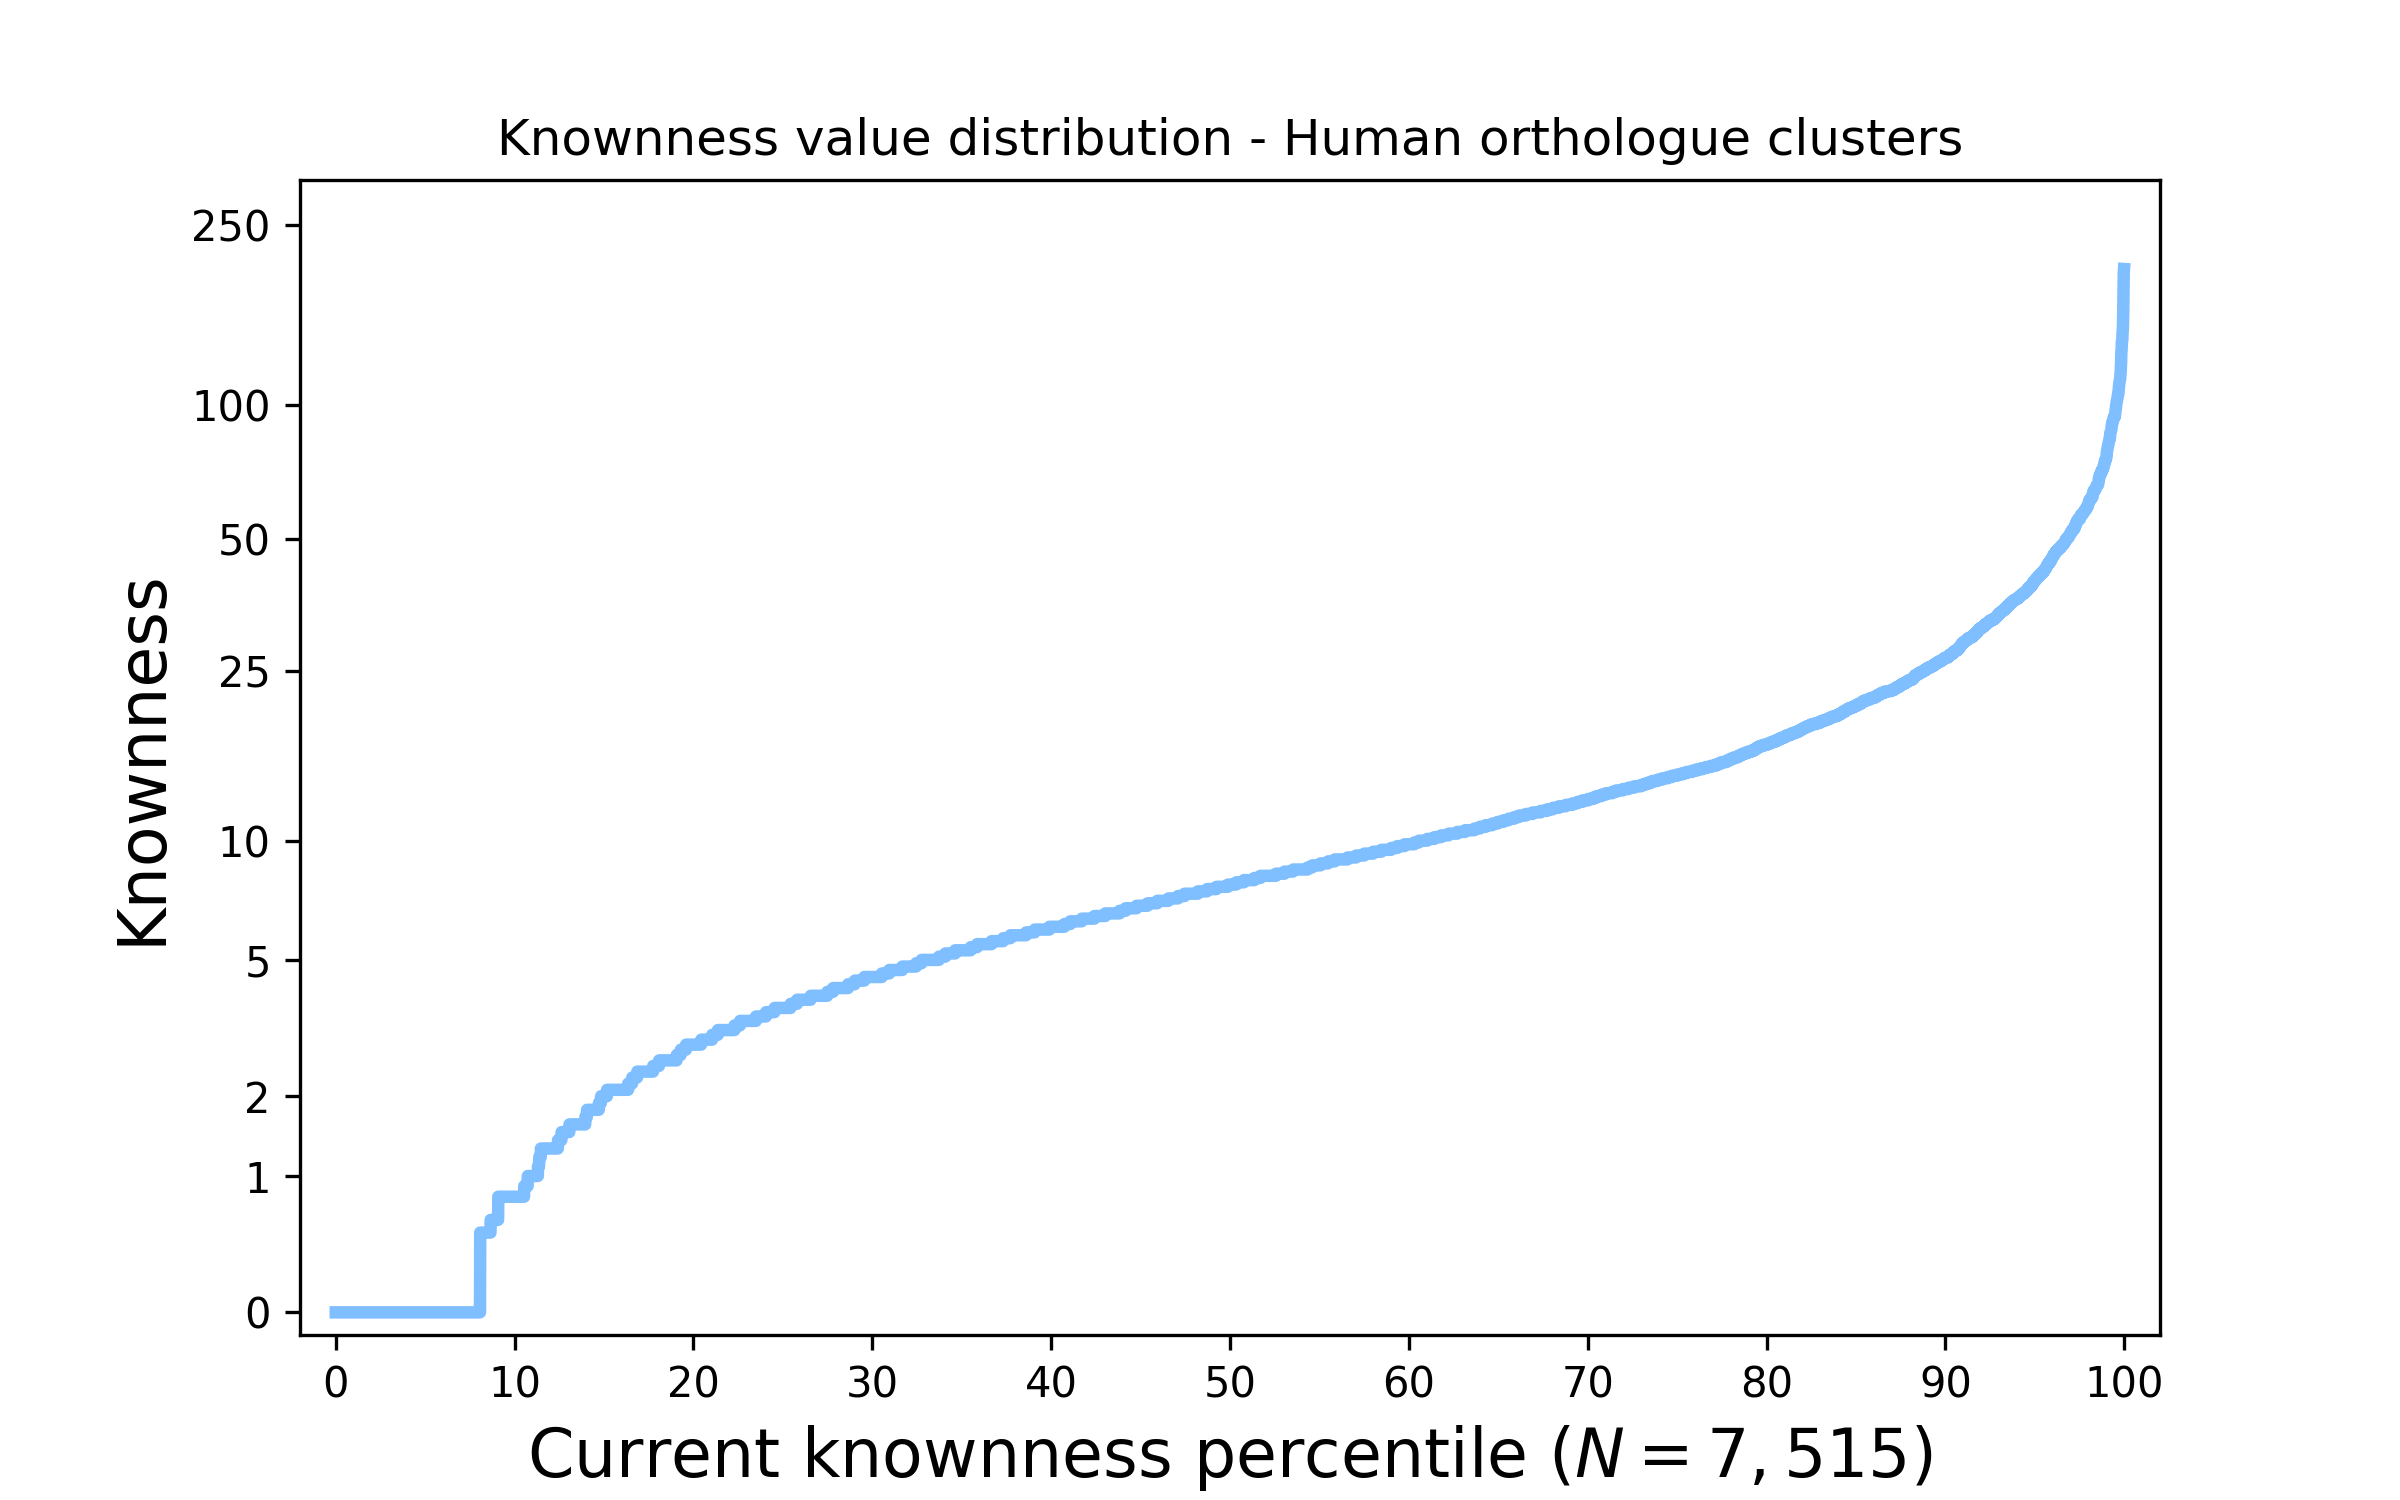
Figure 1. The distribution of knownness across human protein families. The above plot shows how knownness values on a log scale are currently distributed across the Human genome. Values are sorted from low to high knownness and placed on the horizontal axis representing the percentage of Human families; accordingly it is easy to assess what percentage of families are less known than a given value.
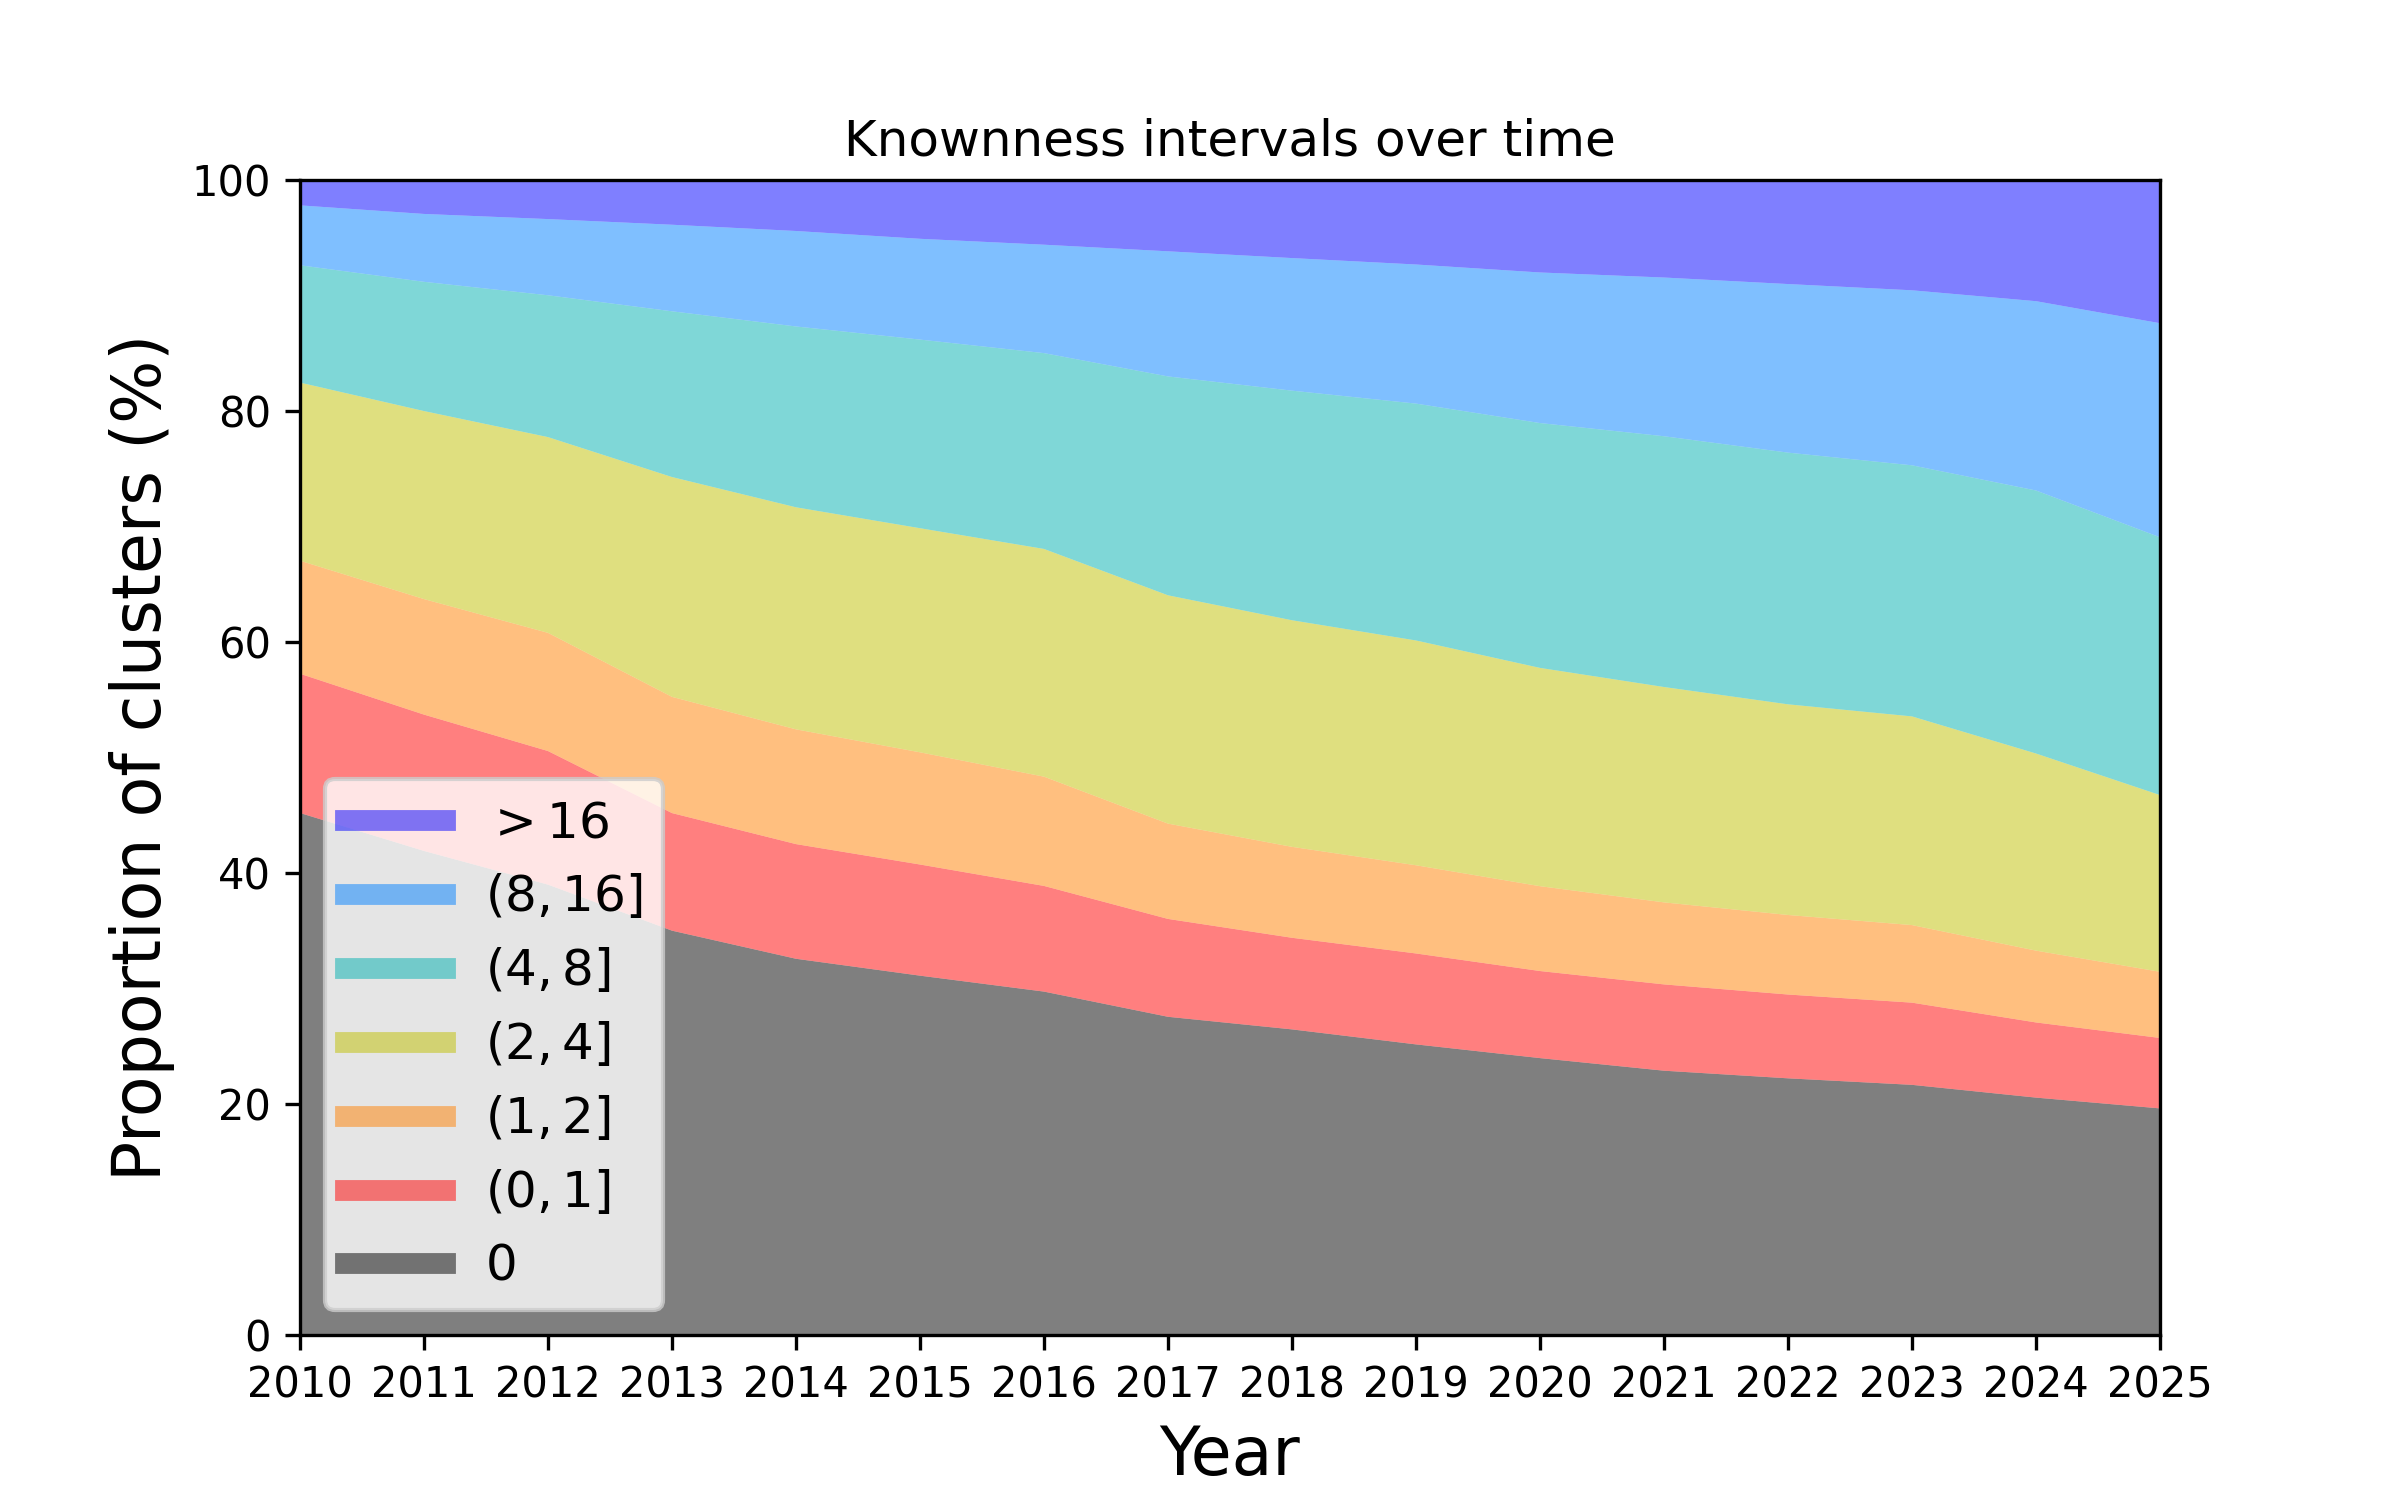
Figure 2. Changes in the knownness of protein families over the years. This plot represents how the knownness of protein families has changed since the year 2010. The height of each colour band represents the number of protein families that have a knownness value within a given interval, at a given year. As time proceeds the proportion of families that are unknown (e.g. knownness < 1.0) diminishes.
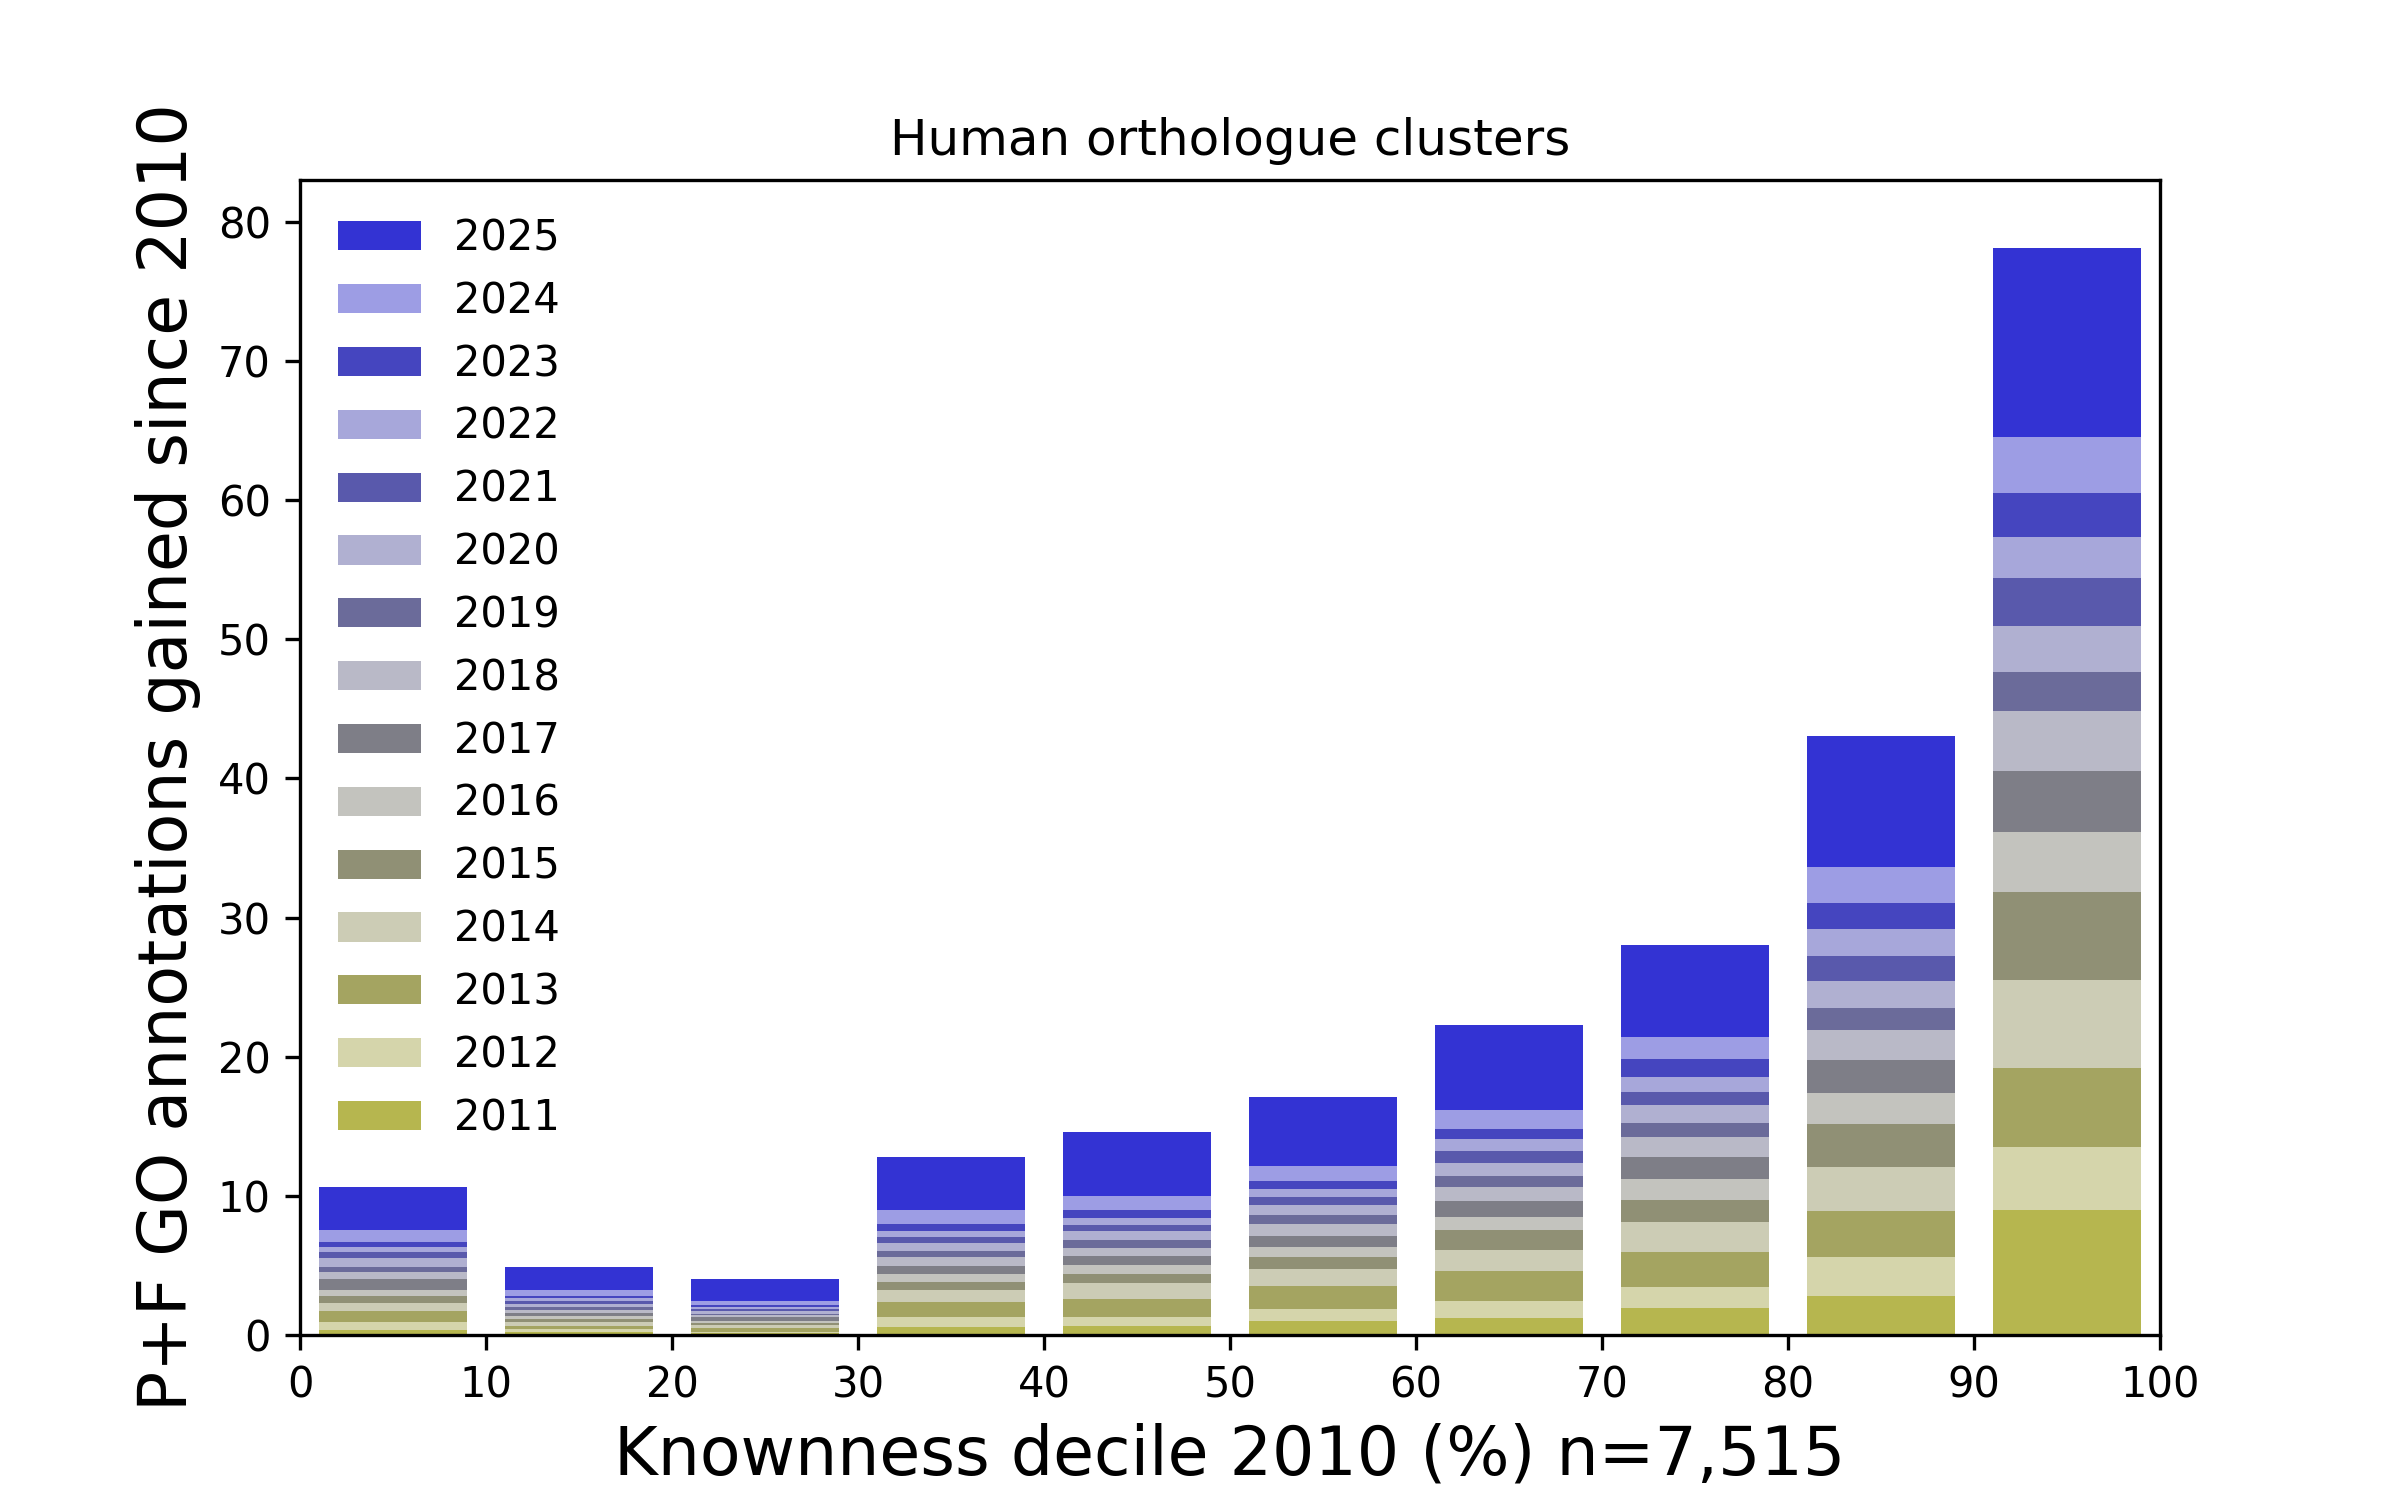
Figure 3. How Gene Ontology annotations have been added to ranked families since 2010. The above plot presents Human protein families that have been ranked according to how well known they were in 2010, and stratified into ten (decile) groups. For each year since 2010 the number of Gene Ontology annotations added to each group (relating to molecular function and cellular process) are presented as a stack of bars. Overall, the proteins that were most well known in 2010 tend to accumulate proportionately more annotations (and hence knownness). This is similar to the Matthew effect.
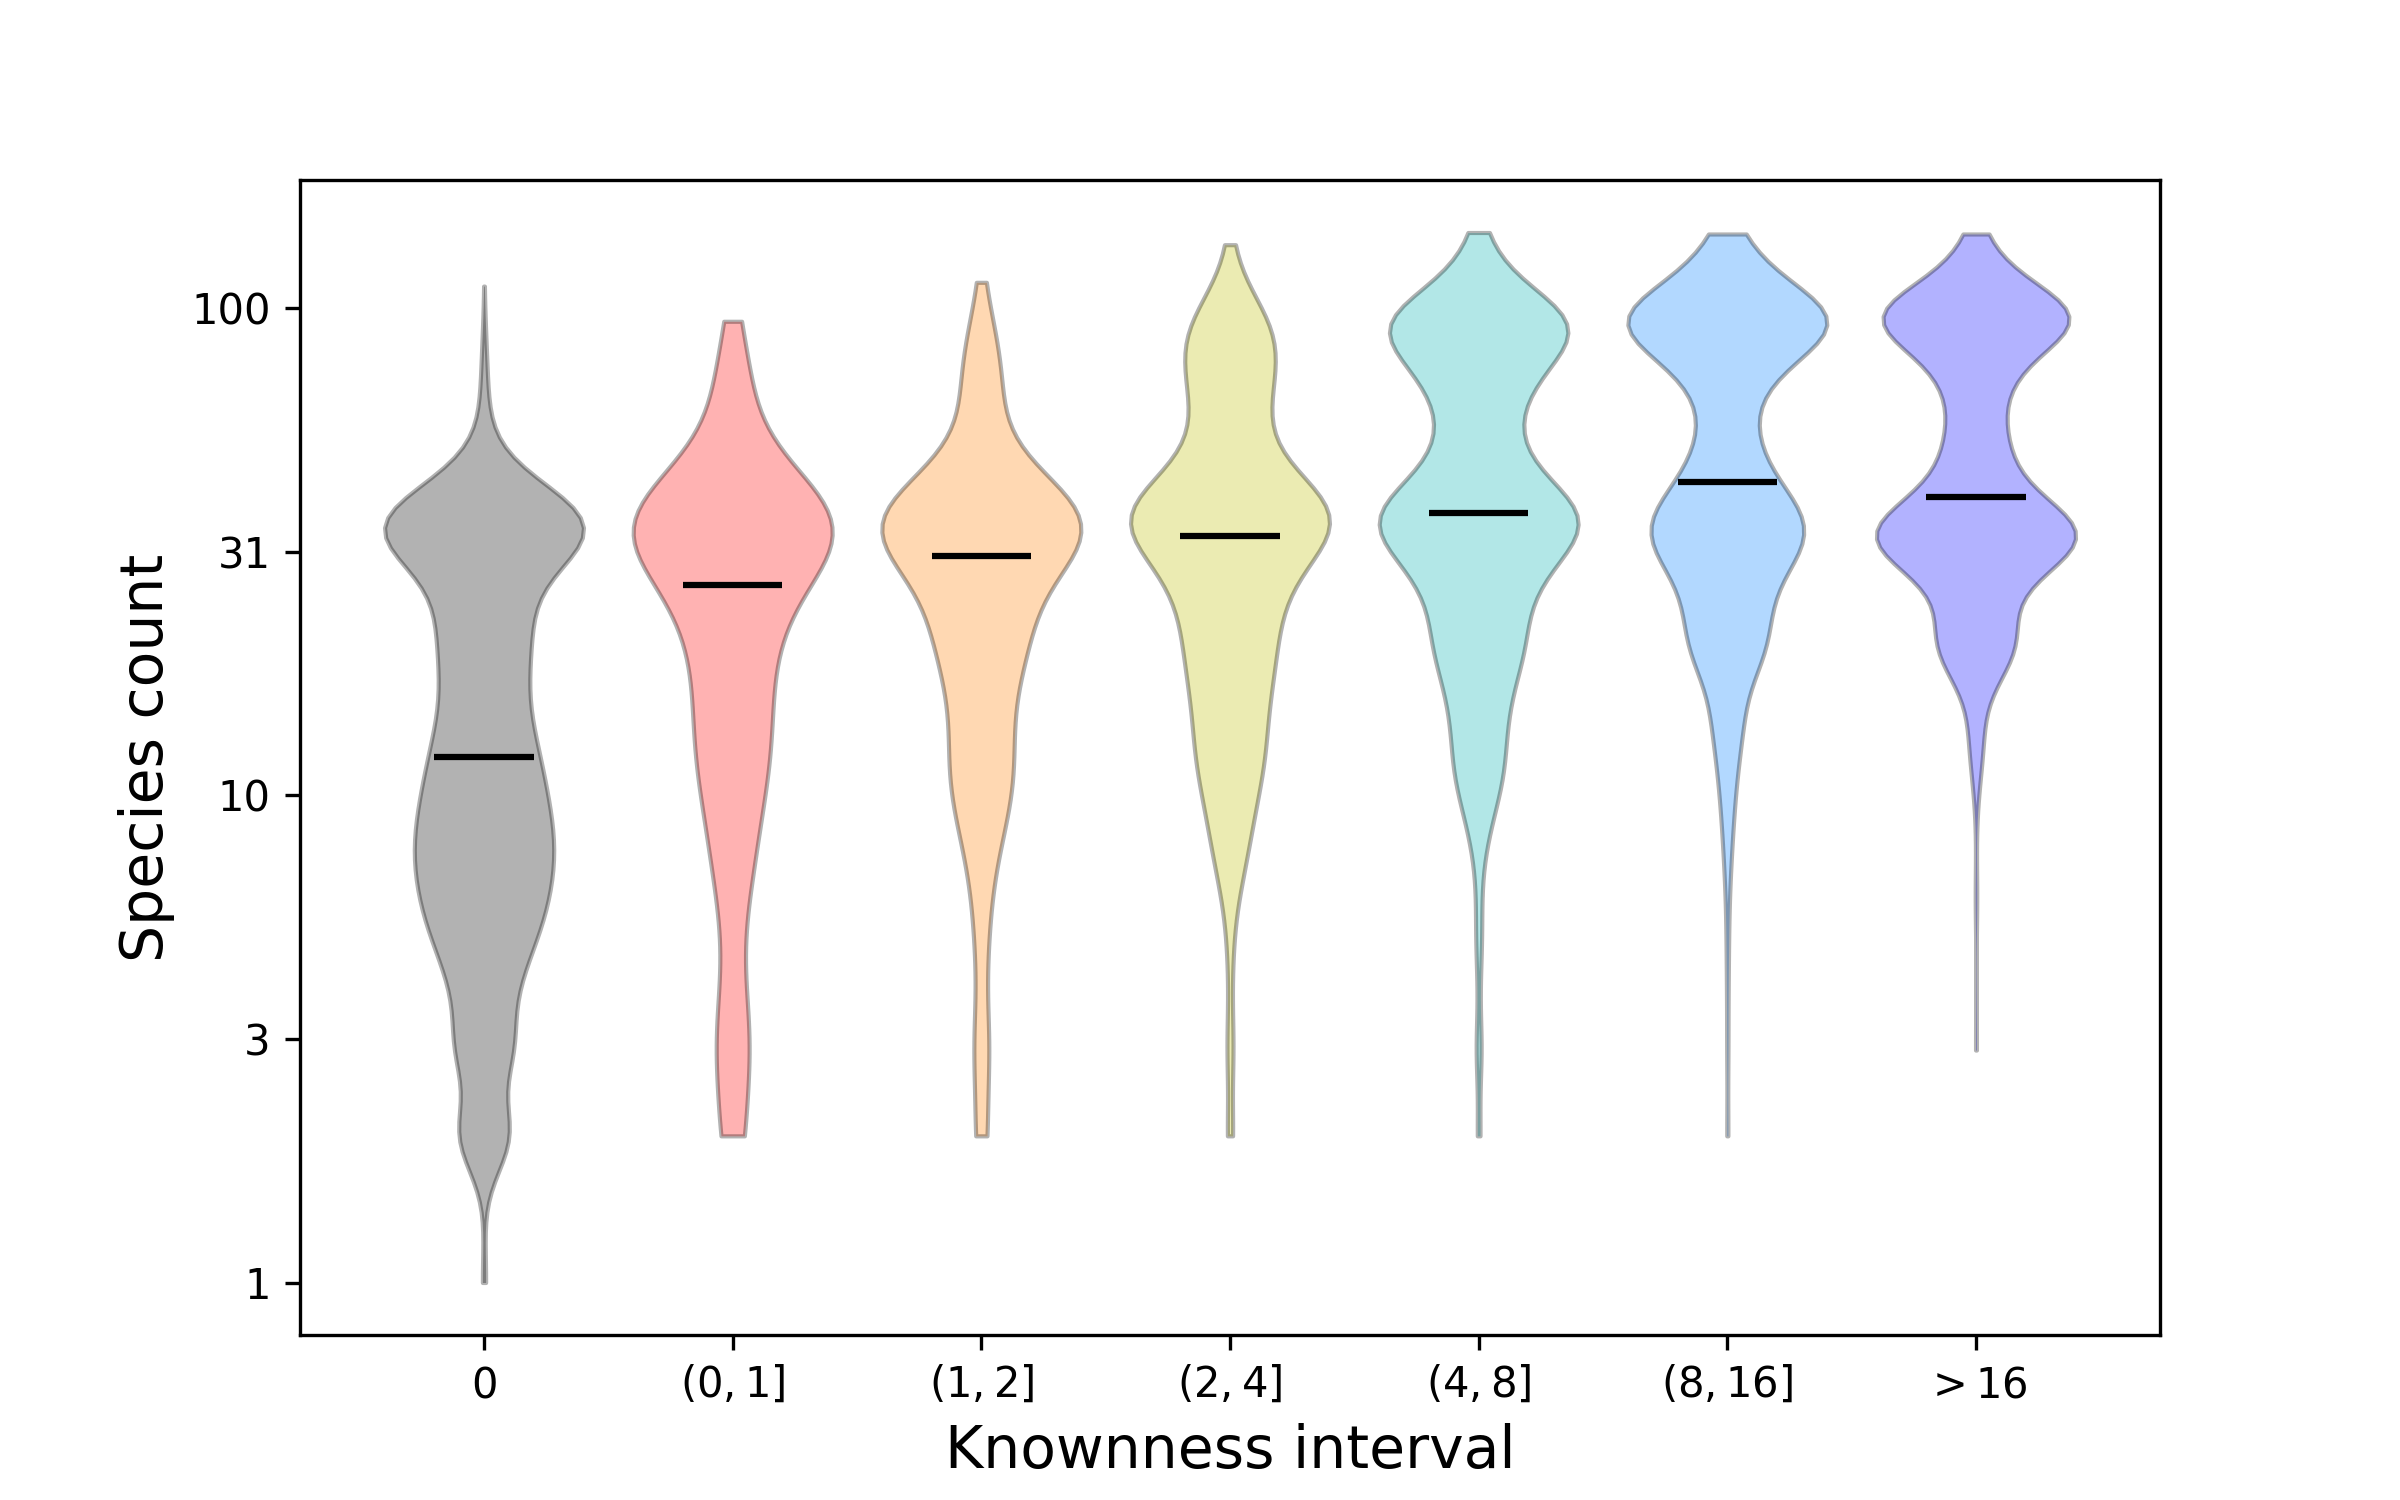
Figure 4. How protein faimily knownness relates to presence across species. This plot shows distributions for how many species are represented by protein families that have been stratified according to knownness value. The double bulge in the distributions shows the difference between families that are found across Eukarya and those that are more restricted to a sub-clade, such as Metazoa. Overall, the better known proteins tend to be found in more species. Nonetheless, there are still many proteins that are widespread, i.e. conserved across species, about which we know relatively little.
Citation and Contributors
Please cite this data using the following reference:
Functional unknomics: Systematic screening of conserved genes of unknown function
Joao Rocha, Satish Arcot Jayaram, Tim J Stevens, Nadine Muschalik, Rajen D Shah, Sahar Emran, Cristina Robles, Matthew Freeman, Sean Munro
PLoS Biol. 2023 Aug; 21(8): e3002222
PMID: 37552676
License and Disclaimer
We have chosen to apply the Creative Commons Attribution 4.0 International (CC BY 4.0)
License to any and all copyrightable parts of the Unknome database. We make no warranties regarding the correctness of the data presented
here, and disclaim liability for any damages that may result from its use. Users of the data are solely responsible for compliance with any
copyright restrictions, patents or other rights. All data is provided “as-is” without any warranty, expressed or implied.